Visualizations
A topic came up in my job about visualization techniques, and there are, of course, many of them. Links to some of these resources will be provided here. However, most techniques cannot display both a class and its attributes in the same view. I came across rdfpuml and decided to use it. The following brief visuals explain how this visualization is embedded in RDF-Editor.
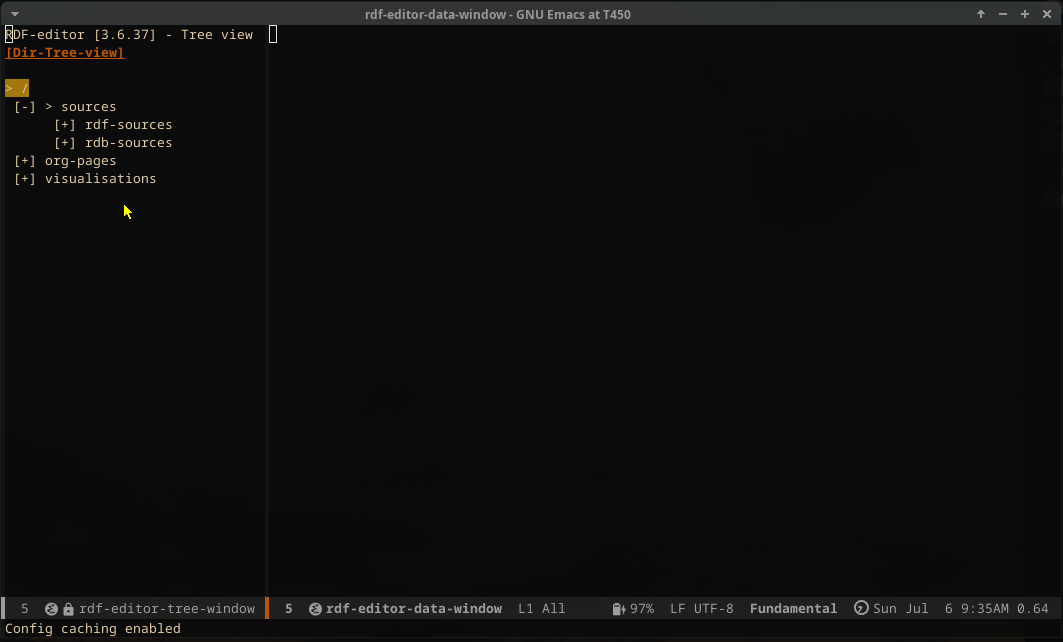
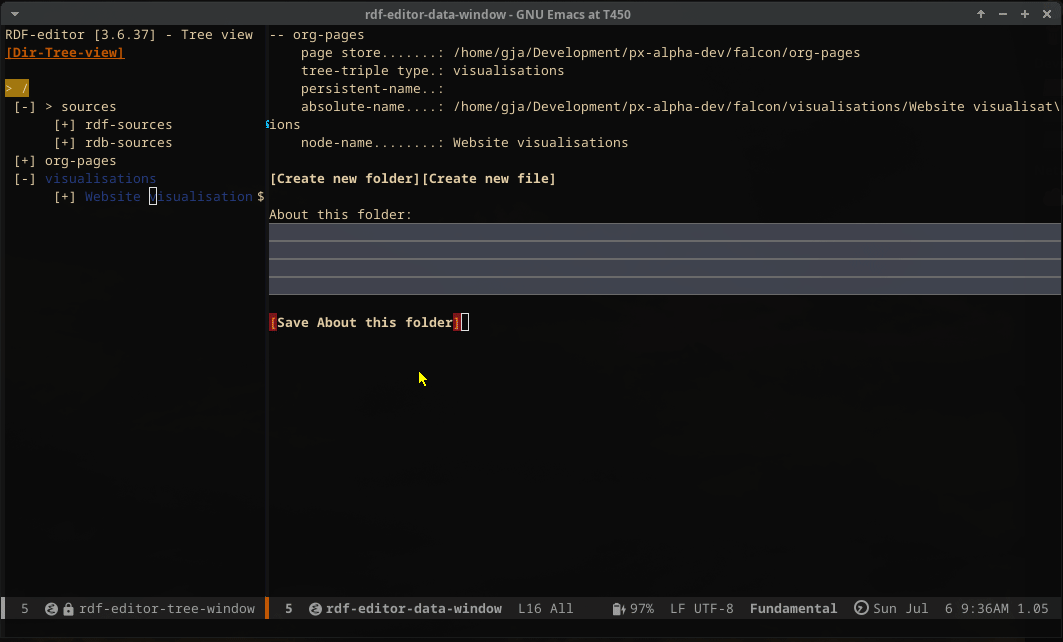
First, there is a new element in the tree: Visualizations. Here, you can add folders to group the visualizations you create.
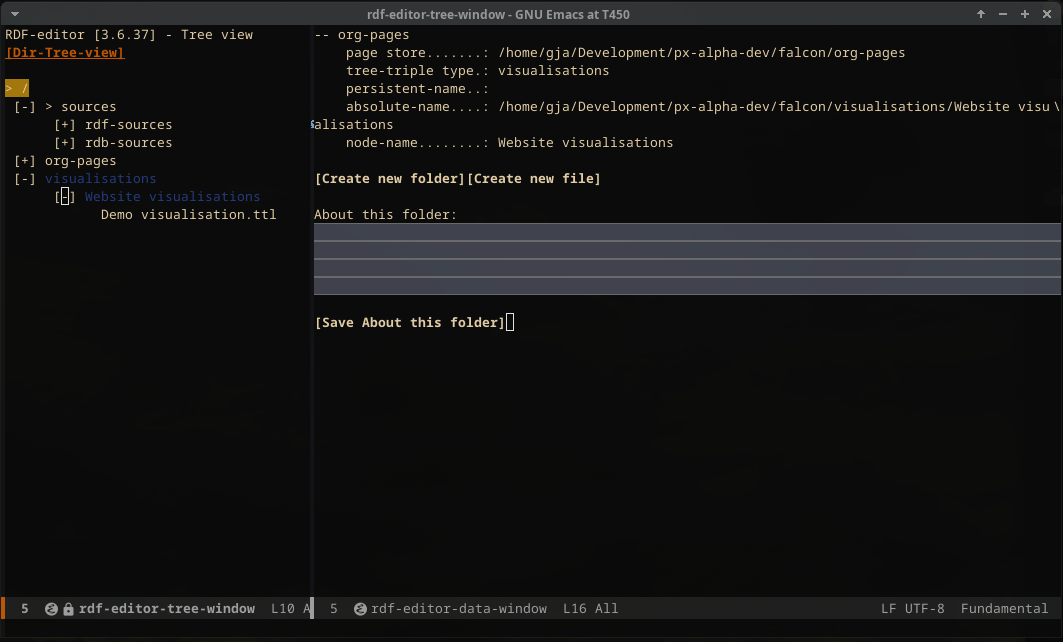
Within the folder, you can create files.
Finally, the files can be opened in Emacs just as you would normally do.
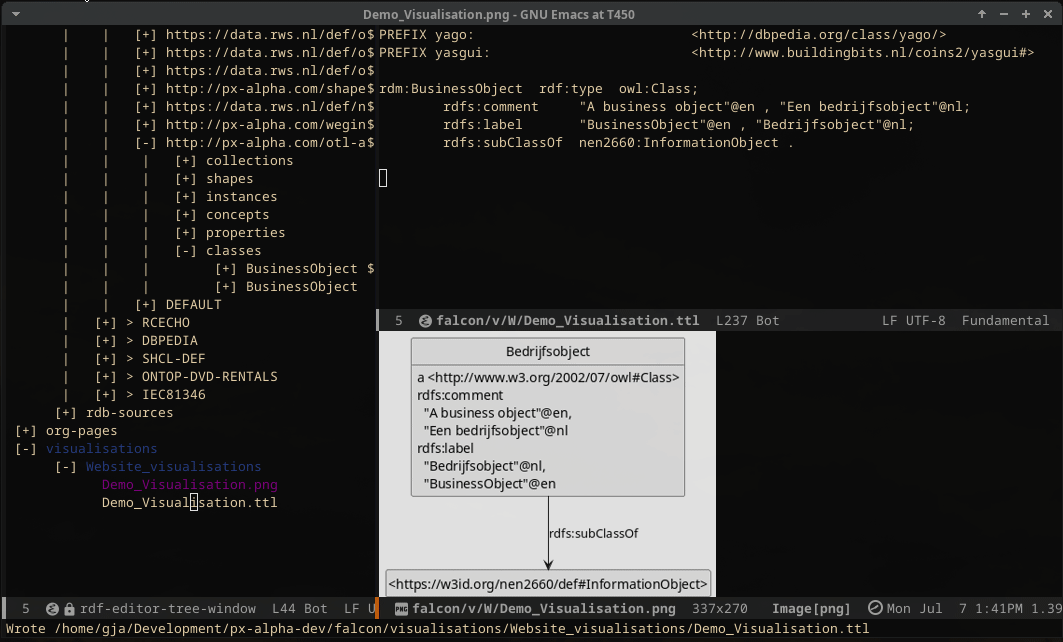
The last file you opened becomes the target for the element you want to visualize. You can open any file, mark a region, and invoke ‘rdf-append-region-to-target-buffer’ (in my setup, bound to C-. r), and the visualization will be displayed.
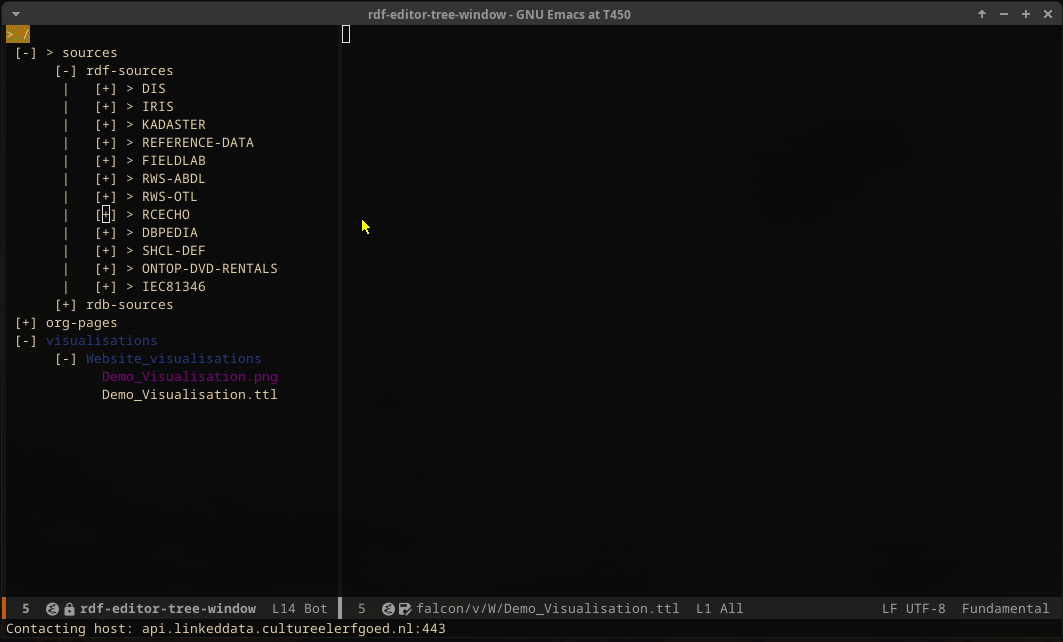
I do not want all the details to be shown, so I will comment out some of them:
Next, add another object and edit the details there as well:
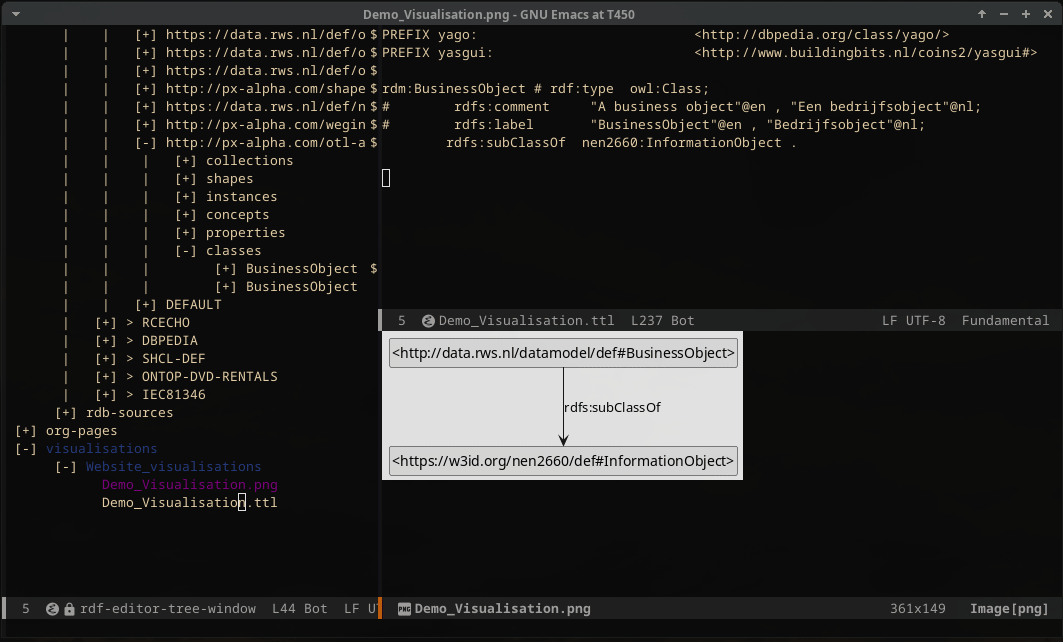
In general, you can continue to copy content to the .ttl file that will be visualized. I have added some extra functionality to the rdfpuml application used in the background for visualization. With the open-sourcing of RDF-Editor, these enhancements will also be made available as open source.